DataLaVista™
Help and documentation
DataLaVista™ is a free dashboard and reporting tool that runs entirely in your web browser. You connect it to a SharePoint list or a data file, shape the data with a visual query builder or with SQL, design charts and tables, and share the finished dashboard with a link. There is no server to set up and no license to buy. Your data stays in your browser and in the places it already lives, and the permissions of those places still apply.
This page is the starting point for the help. The guides take you through each step of building a dashboard. The pages at the end are for people who maintain the code.
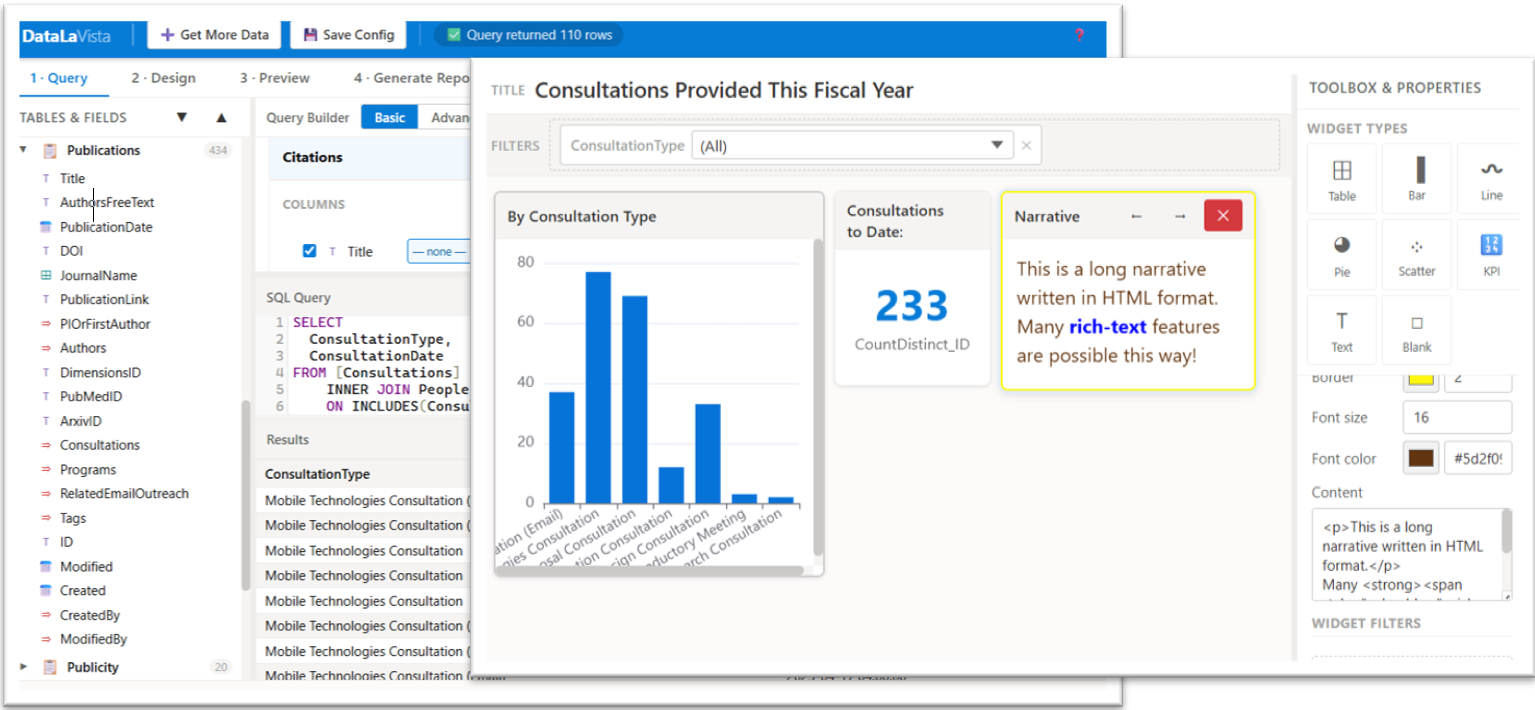
Dashboard Development Steps
Every dashboard follows the same path through the four tabs of the designer:
- Query. Connect to your data, pick tables and fields, join and reshape them, and check the result in the preview table.
- Design. Place charts, tables, KPIs, and text on the canvas, add filters, and map your fields to each one.
- Preview Dashboard. Look at the dashboard the way other people will see it, try the filters, and check the numbers.
- Generate Report. Save the dashboard to a SharePoint library or to your computer, and share the link.
Getting the query right first makes the other steps faster. You can also change the data source later and keep the same design.
Guides
- Get started: open the live demo, run DataLaVista from a file or inside another website, and build a first dashboard with sample data.
- Install DataLaVista in SharePoint: upload one file to your site, add one page, and update it later.
- Connect to data: SharePoint lists, files on your computer, and files on the web, plus the extra fields DataLaVista adds for you.
- Build a query: the query builder, the SQL editor, and the checks to make before you design.
- Design a dashboard: widgets, field mapping, totals and averages, and filters.
- Preview a dashboard: what to check before you share, and how to download the data behind a chart.
- Publish and share a dashboard: save to SharePoint or to a file, the share link, and who can see what.
Answers
- Frequently asked questions: what DataLaVista is good for, its limits, and where your data goes.
- Troubleshooting: what to do when a file does not load, a page stays blank, or the numbers look wrong.
For developers and maintainers
- Architecture: the pieces of the app and how data moves through them.
- Repository maintenance: source files, library copies, the build, the tests, and how the website is published.
- Compliance: the security and accessibility controls in the code today, and the known gaps.
- Skill authoring examples: recipes for writing small skills for coding assistants.
- Documentation template: the structure to copy for a new help page.
- Third-party notices: the libraries packed into DataLaVista and their licenses.
- Project README: the short description, credits, license, and citation on GitHub.
- Project instructions: the rules that contributors and coding assistants follow.
Related resources
- DataLaVista on GitHub: the code, releases, and issue tracker.
- DataLaVista knowledge base article: the entry in the EFDC Health Research Resource Library.
- Eisenberg Family Depression Center open source hub: other free tools from the center.
- Mobile Technologies Core: the team that supports DataLaVista.
- Modern Script Editor web part: needed to add DataLaVista to a SharePoint page.
- Automators Anonymous: the community of practice that helped build DataLaVista.
- Overview of SharePoint lists: an EFDC article on how SharePoint lists work.
- News article about DataLaVista: Michigan IT News, March 2026.
Citation
If DataLaVista helps your research, please cite it: Mongefranco, Gabriel; Gluskin, Jeremy; Boa, Shelley (2026). DataLaVista™. University of Michigan. Software. https://doi.org/10.5281/zenodo.19245606